
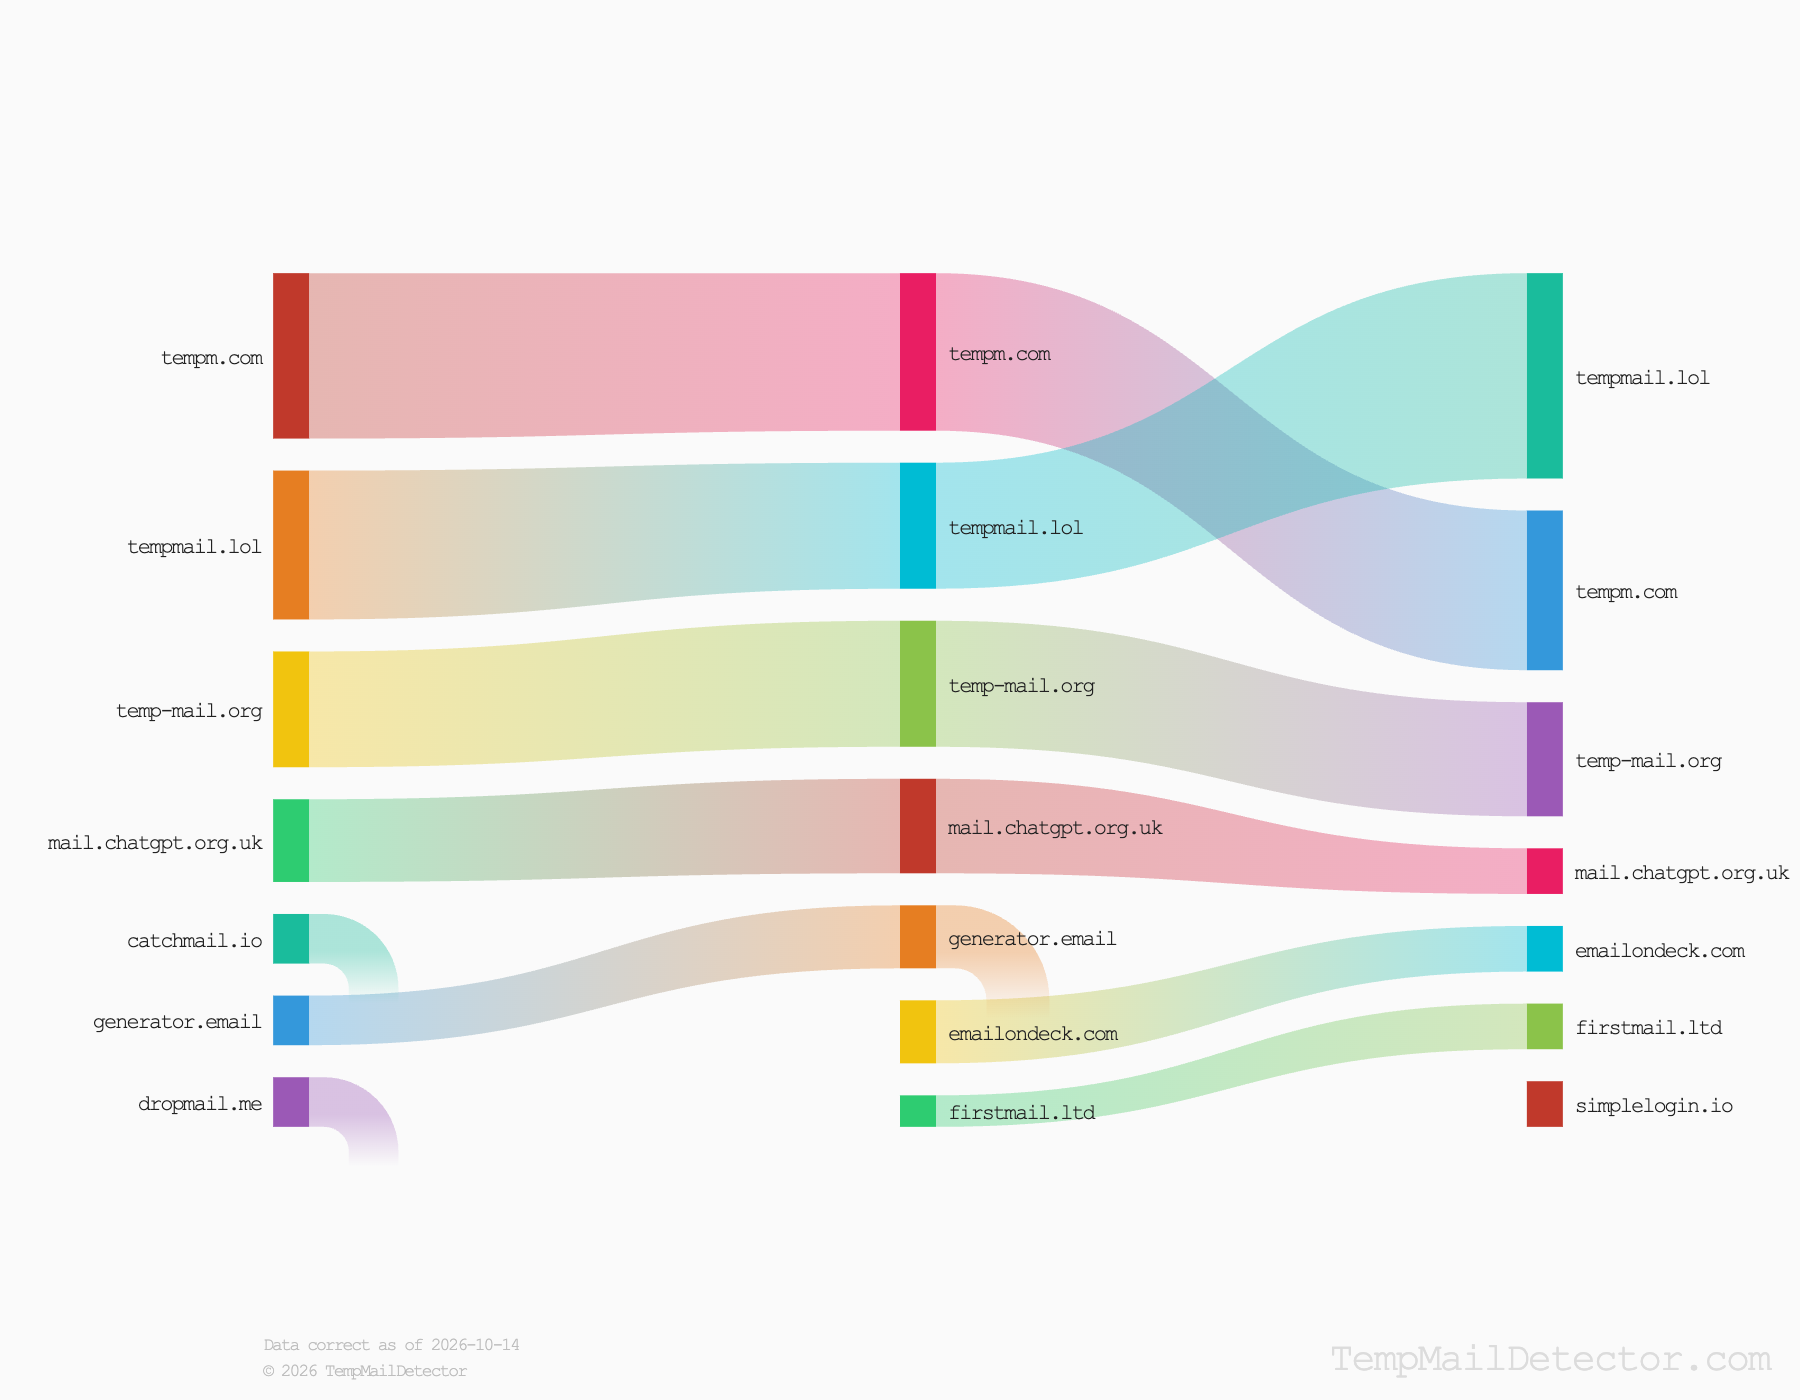
In September 2026, tempmail.lol accounted for a third of the detections we recorded among the providers shown on our chart, making it the most detected temporary email provider that month. tempm.com held that position in both July and August, so September is the first month this quarter with a different provider in front.
The rankings come from our temporary email market share chart. Every address a business checks with TempMailDetector that belongs to a known disposable provider counts towards that provider’s total, so the chart shows what is actually turning up on the signup forms our customers protect.
Where everyone placed, month by month
| Provider | July | August | September |
|---|---|---|---|
| tempmail.lol | 2nd | Joint 2nd | 1st |
| tempm.com | 1st | 1st | 2nd |
| temp-mail.org | 3rd | Joint 2nd | 3rd |
| mail.chatgpt.org.uk | 4th | 4th | Joint 4th |
| generator.email | 5th | Joint 5th | n/a |
| emailondeck.com | n/a | Joint 5th | Joint 4th |
| firstmail.ltd | n/a | 7th | Joint 4th |
| catchmail.io | 0 | n/a | n/a |
| dropmail.me | 0 | n/a | n/a |
| simplelogin.io | n/a | n/a | 0 |
“Joint” marks providers that were level that month. “n/a” marks months where a provider is not on the chart. “0” marks a provider named on the chart that month with no measurable share; see the note on the scoring scale below. By September, the top two between them accounted for roughly six in ten detections among the providers shown.

A note on the scoring scale
The source describes scores as running from 1 to 10, yet three providers are named on a monthly chart with no measurable share: catchmail.io and dropmail.me in July, and simplelogin.io in September. The published data does not explain how a named provider maps to a zero, so we report them as named but unmeasured rather than assign them a position. Everything else in this post concerns providers with a measurable share.
tempmail.lol: from second in July to first in September
tempmail.lol began the quarter in second place, not far behind tempm.com. August left it level with temp-mail.org in joint second. September put it in front on a third of detections, with tempm.com on a quarter.
Two score movements produced that result. Every provider that stayed on the chart scored lower in August than in July, and the month’s scored total fell with them. tempmail.lol was the only provider back at its July score by September, while tempm.com remained below its own. Because the chart publishes relative scores rather than counts, the data cannot separate a fall in disposable addresses reaching signup forms from a fall in checking activity overall, or from movement towards providers the chart does not name. The change at the top does not depend on settling that question: it is a change in shares among the shown providers, and it holds whichever way the August fall is read.
tempm.com: largest in July and August, second in September
tempm.com carried the largest share of detections in July and August, roughly three in ten in July and close to a quarter in August. September’s share changed little, but tempmail.lol’s September score matched its July level while tempm.com’s did not, which is what moved tempm.com into second. Its September share remains well above the providers below it.
temp-mail.org: third in July and September
temp-mail.org held roughly one in five detections in both July and September, and ranked third in each. In August it drew level with tempmail.lol in joint second before the two separated again. It never left the top three across the quarter.
mail.chatgpt.org.uk: the largest share decline of the quarter
mail.chatgpt.org.uk held fourth place in July and August, with a share just under 15% in both months. September took it down to about one in fourteen, roughly half its July share, low enough to be caught by the smaller providers. The fall is the largest in the table, and our data doesn’t show what sat behind it.
The lower half: movement shaped by the chart’s cut-off
The bottom of the chart changed more between July and September than the top did, but most of that movement reflects the chart’s seven-place limit rather than falling shares. generator.email is the clearest case: its share rose from July to August, from under a tenth to about a tenth, yet it left the chart in September. catchmail.io and dropmail.me were already without a measurable share in July and were gone by August. emailondeck.com and firstmail.ltd entered in August, and firstmail.ltd climbed from last place at under one in twenty to joint fourth in September. simplelogin.io is named in September only, with no measurable share.
Six of the ten providers named this quarter moved in or out of the monthly chart. With places decided by small margins at the bottom, the data does not show whether these entries and exits reflect changes in provider use or only changes in ranking order.
Takeaways
- The composition of the top three is stable; the ordering within it is not. tempmail.lol, tempm.com and temp-mail.org were the three largest providers in every month of the quarter, and the order at the top changed once in September.
- Every score fell in August, and the data cannot say why. Scores for all providers that stayed on the chart fell between July and August, and the scored total fell with them. The published data cannot distinguish fewer disposable submissions from lower checking activity overall, so the fall should not be read as a change in disposable email use.
- Lower-half exits track the chart’s cut-off, not falling share. generator.email’s share rose from July to August and it still left the chart in September, and the two July-only providers already had no measurable share. Turnover in the table is a feature of the seven-place limit as much as a signal about providers.
- Concentration rose across the quarter. The top two held roughly six in ten detections among the shown providers in September, up from under half in August.
How the rankings are built
- What counts as a detection. Each time a business checks an email address with TempMailDetector and it belongs to a known temporary email provider, that provider gets one detection whether the address came from a person signing up or from and automated attack. The rankings reflect what our customers see on their signup forms, not every temporary email address in use.
- Who appears. Each month’s chart names the seven biggest providers that month, and the table above combines those monthly charts into one view, so ten providers appear across the quarter. Places are decided by small margins at the bottom, so a provider can leave the chart without its share having fallen.
- What the scores can and cannot show. We publish each provider’s monthly detections as a relative score rather than an exact count, so shares here are approximate and small gaps between providers shouldn’t be read as precise. Score movements also move with overall checking activity, which the published data does not separate from provider-specific change.
- The zero-score gap. The stated 1 to 10 scale and the three providers named with no measurable share are features of the published data we cannot reconcile from the outside. We flag them rather than resolve them.
- Full months only. Every column is a complete calendar month, and October will join the chart once it ends.