

From a sample of 257,054 web domains, the busiest ones turned out to be the cleanest with 40 bad endings carry a third of all the spam.
Temp Mail Detector is a throwaway temp mail detection provider. People use us to stop free trial abuse and to keep their customer base clean. We don’t analyse the emails, but we do analyse the domain then provide a risk score based on our findings.
We checked 257,054 unique domains, though the total number of lookups is considerably higher. The dataset contains real people and real companies, university departments, side projects, and a surprisingly high number of burner addresses. Given that, we thought it would be interesting to look at which domain endings attract the most abuse.
At a high level, this is what we found:
- 257,054 domains checked, 1,512 top-level domains (plus 108 endings that aren’t TLDs at all, see below), 33,965 blocked (13.2%).
- Popular doesn’t mean dirty. Bigger TLDs are no more abusive than small ones and very slightly less, in fact.
- 40 endings out of 1,512 carry 29% of all the junk, and cost you only 1.40% of the good domains to block.
.xyzis 1% of the domains we see but 9% of everything we block.- Three education endings -
.edu,.edu.it,.ac.in- are 4,194 domains with zero blocks.- The simple way of counting endings (split on the last dot) hides the two worst endings in the entire dataset.
Popularity Doesn’t Predict Abuse
The obvious guess is that the popular endings are the dirty ones, but you (and I) would be wrong to assume that.
.com is by far the biggest TLD in our data set: 110,098 domains which represents 42.8% of everything we’ve
checked. If any ending were going to be a spammy, you’d think this would be it.
Its block rate is 11.9%. That’s below the overall average of 13.2%.
Meanwhile .xyz sits at around 3,500 domains (1/30th the size) and has
85.2% blocked.
| Ending | Domains | Blocked | Blocked % |
|---|---|---|---|
.com |
110,098 | 13,142 | 11.9% |
.org |
12,067 | 1,811 | 15.0% |
.net |
7,747 | 1,237 | 16.0% |
.it |
4,562 | 20 | 0.4% |
.xyz |
3,542 | 3,019 | 85.2% |
.edu |
1,789 | 0 | 0.0% |
.top |
827 | 683 | 82.6% |
We ran the numbers on the 40 busiest endings to be sure this wasn’t just a fluke. Statisticians use a number called r to measure whether two things move together. +1 means they always move together, 0 means they have nothing to do with each other and −1 means they move in opposite directions.
We got r = −0.04. That is as close to zero as makes no difference.
This effectively means:
Popularity tells you nothing about abuse. Across the 40 busiest domain endings in a 257,054-domain study, how big an ending is explains essentially none of how dirty it is (r = −0.04).
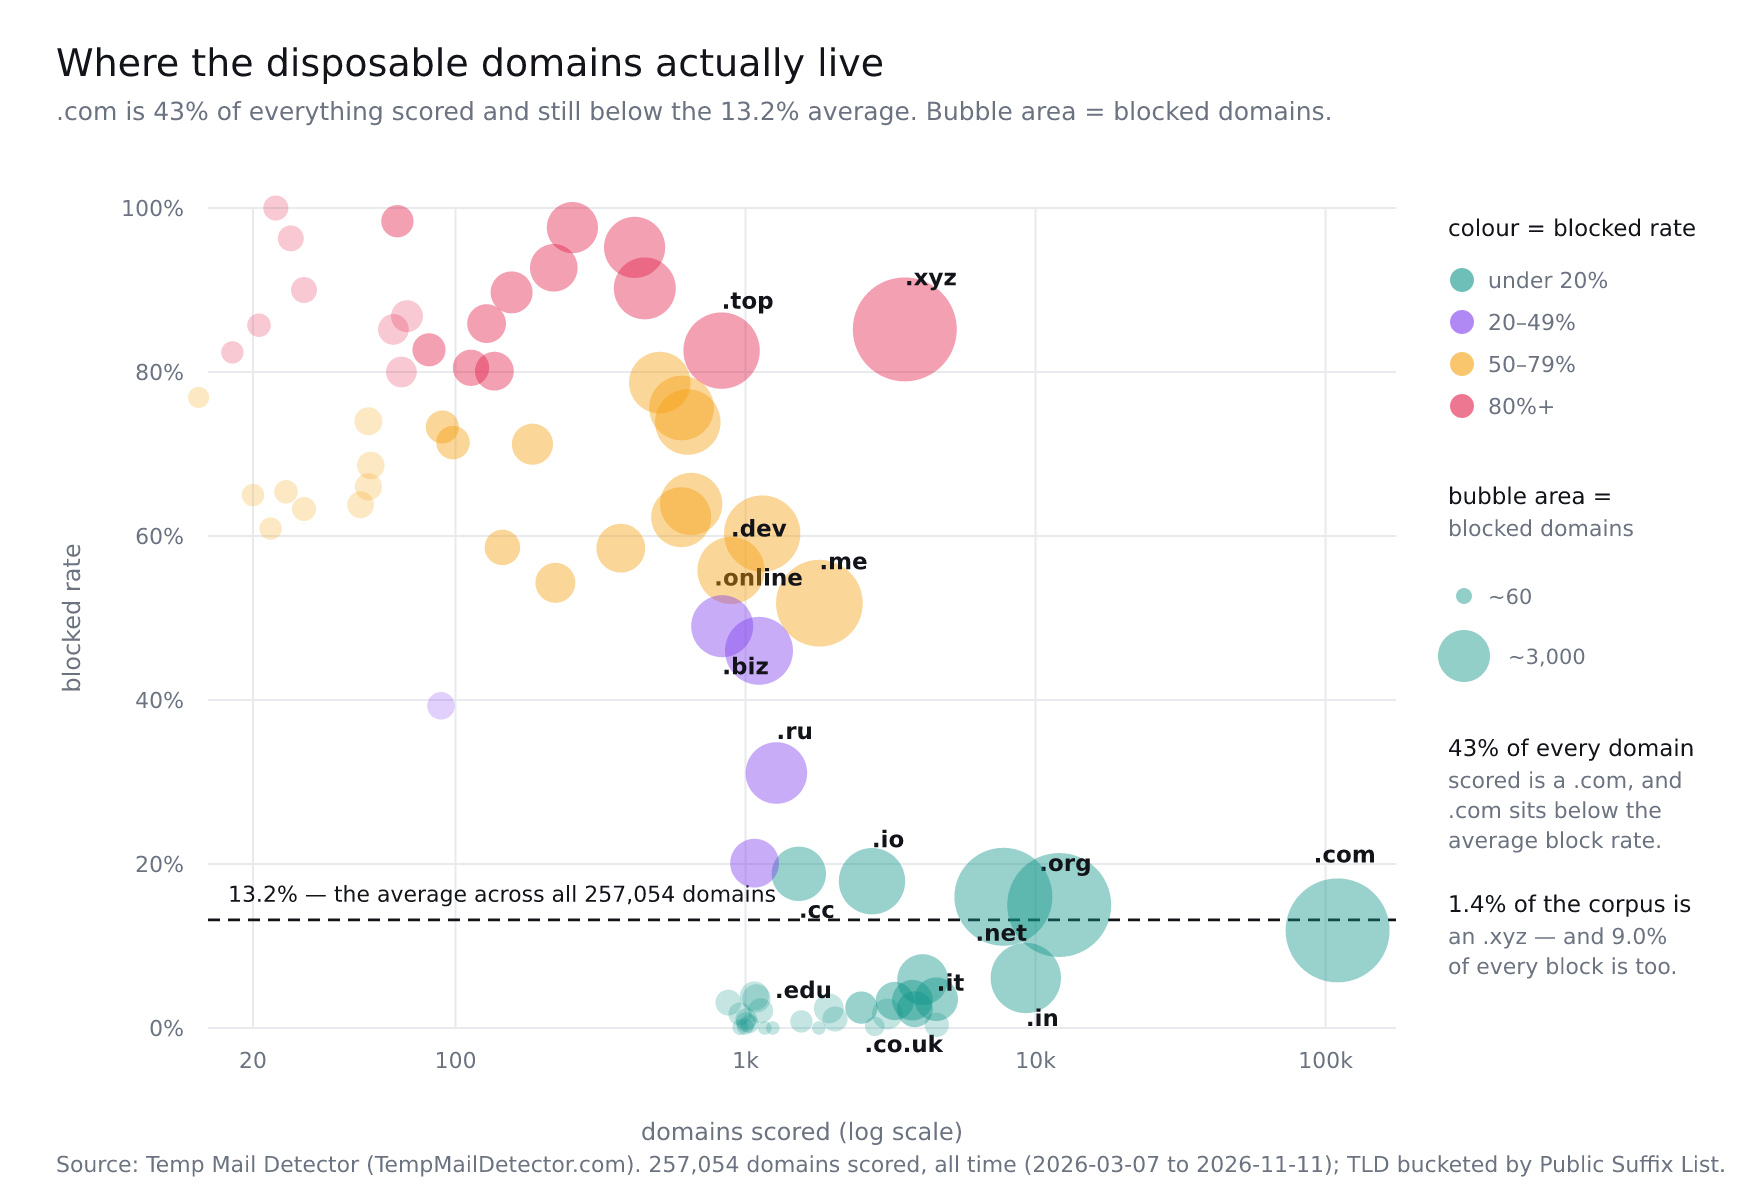
Each bubble is one ending. Right = more domains checked and Up = more of them blocked while the size shows how many were blocked. If bigger meant an overall dirtier domain, the bubbles would climb in a line to the right. They don’t, and they’re scattered, meaning that domain popularity isn’t a predictor of abuse.
A quick warning before you get excited by the worst number in that chart.
.skin has a 100% block rate. It’s also got 24 domains analysed. The same happens for .nf (98.4% blocked @ 63 domains) and .help (85.7% blocked @ 21 domains). A 100% score on 23 domains tells essentially nothing and it’s not remotely statistically significant. Still interesting to include.
Which TLDs Carry the Most Abuse?
When sorting all 1,512 real top-level domains from dirtiest to cleanest, we found the following:
| # of worse domains combined | Abuse caught | Share of ALL abuse | Good domains caught too | Share of ALL good domains |
|---|---|---|---|---|
| 5 | 758 | 2.3% | 28 | 0.01% |
| 10 | 1,570 | 4.7% | 108 | 0.05% |
| 20 | 5,754 | 17.1% | 817 | 0.38% |
| 40 | 9,968 | 29.3% | 3,134 | 1.40% |
By blocking the 40 worst endings, you stop 29% of all the abuse. You also catch ~1.40% of legitimate people and businesses in the process, so don’t actually do this, but it gives a good idea of just how bad some of these TLDs are.
Just to re-iterate how crazy this number is: catch 9,968 bad domains, sacrifice 3,134 good ones.
If we continue with this, the 20 worst endings catch 7 junk domains for each innocent one, but if we still factor in that .skin has a 100% block rate, you can see how a few TLDs with low volumes but high block rates can skew this slightly.
Educational domains maintain their reputation
The best scoring domains are (unsurprisingly) schools and universities. .edu (United
States), .edu.it (Italy) and .ac.in (India) which between them we’ve checked
4,194 domains. Of those we have blocked exactly zero .edu, .edu.it or .ac.in education domains.
On the other hand, .top at 827 domains scanned has 683 blocked domains, which is an 82.6% block rate.
| Ending | Domains | Blocked | Blocked % | What it is |
|---|---|---|---|---|
.edu |
1,789 | 0 | 0.0% | US universities |
.edu.it |
1,241 | 0 | 0.0% | Italian universities |
.ac.in |
1,164 | 0 | 0.0% | Indian universities |
.com.au |
2,792 | 6 | 0.2% | Australian ccTLD |
.it |
4,562 | 20 | 0.4% | Italian ccTLD |
.top |
827 | 683 | 82.6% | - |
.xyz |
3,542 | 3,019 | 85.2% | - |
Domain Volume vs Block Rate: What the Data Shows
Here, each TLD gets one dot where the horizontal axis means more of that ending’s domains got blocked, the vertical axis means it has a higher risk score on average, and bigger circles means more domains were checked for that TLD, while colour is how often it gets blocked.
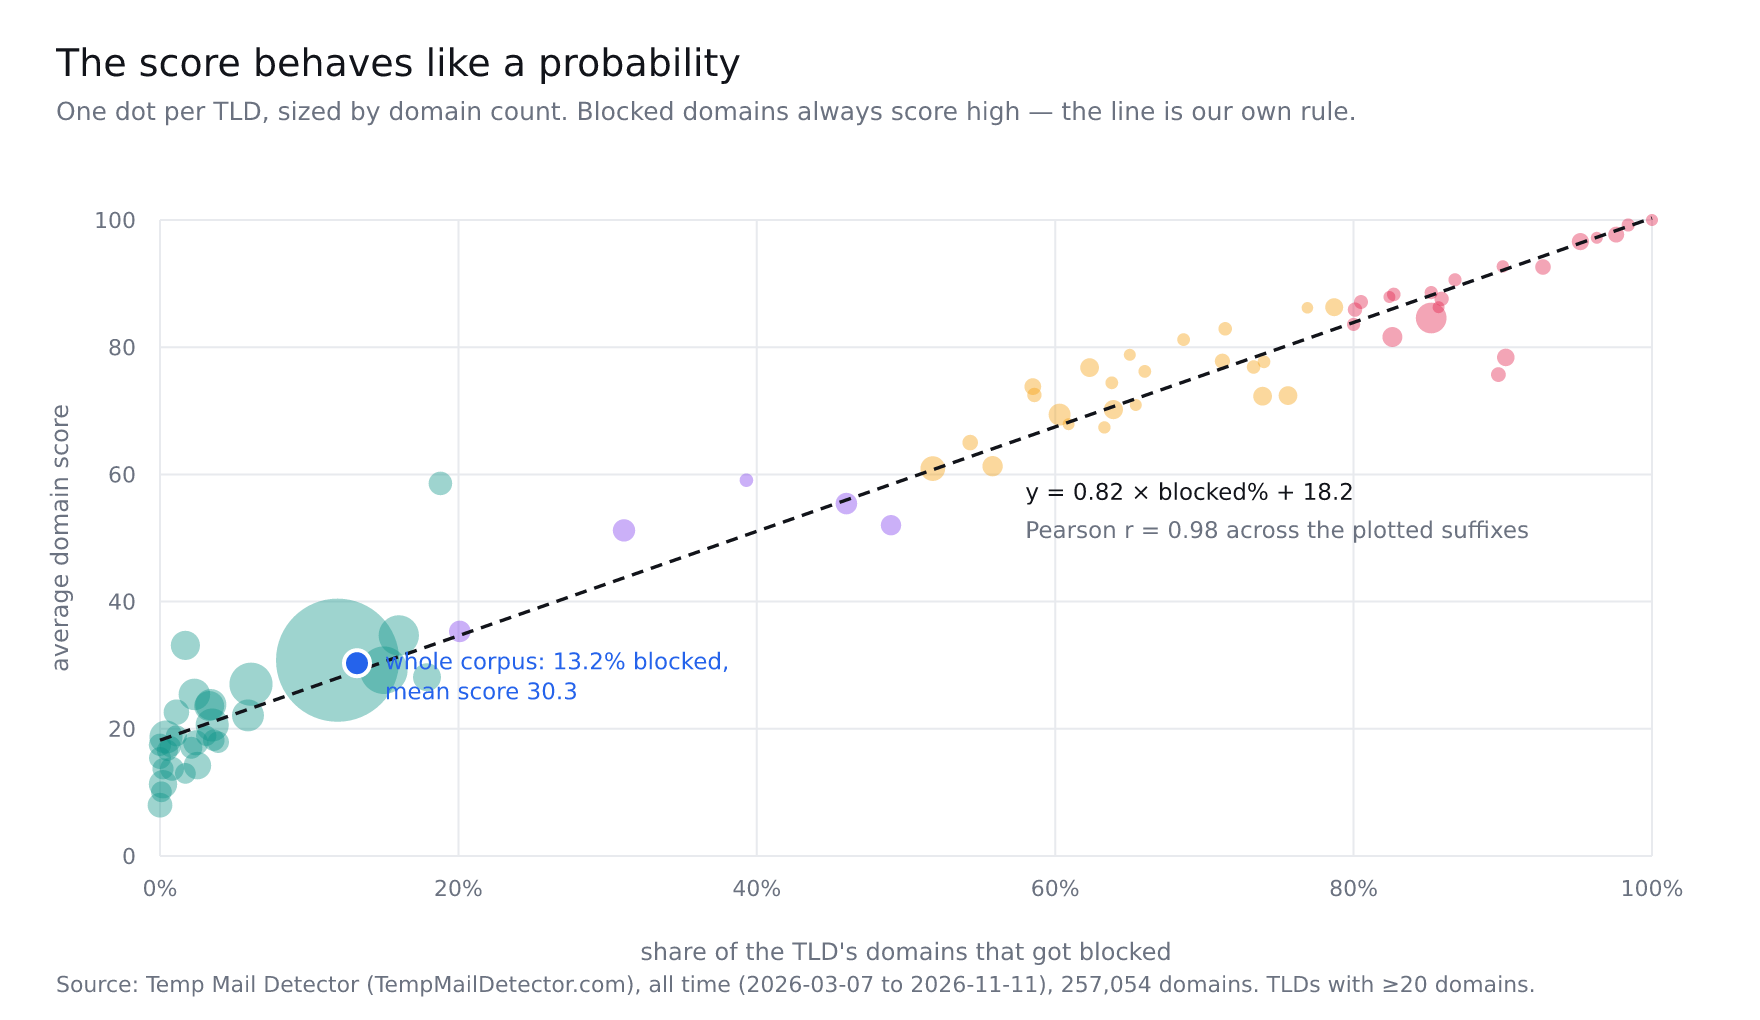
The first thing you notice is that the dots run in a nice line. Endings we block a lot are the same endings that score high, and endings we rarely block score low. But as we’ve previously touched on, size doesn’t always affect a domains reputation either: the biggest dot on the chart is .com, and it sits low on the left hand side.
The second thing to point out is that the line doesn’t start at zero. The university domains we discussed earlier average between 8-18⁄100. Every domain has a risk score, and no domain is perfect.
The cleanest endings in the dataset block under 0.5% of their domains and still average scores between 8 and 18.
.edu- zero blocks across 1,789 domains - averages 8.1 out of 100.
Then we have the TLDs that sit above the line, where an ending scores far higher than it gets blocked:
.cc- blocks 19%, scores 59.ai- blocks 1.7%, scores 33.ru- blocks 32%, scores 52
.ai is an interesting one. It blocks almost nothing - 1.7% - yet scores about as high as endings we block twenty times as often. .ai is where AI startups live (and now .si too). An AI startups looks young enough that the domain seems questionable but is completely legitimate. We can compare this to many providers who buy cheap new domains, so .ai will naturally be somewhat affected by this.
.aiblocks 1.7% of its domains but scores 1.8 times higher than its block rate predicts. Being new and being a spammer share a common pattern.

Why a Naive TLD Split Hides the Worst Suffixes
The quickest way to group domains by ending is to split on the last dot and keep the tail. That’s wrong when ever the ending itself contains a dot. .co.uk isn’t the same ending as .uk, and .my.id isn’t .id, as they’re entirely separate namespaces with entirely separate owners and completely separate reputations, so if you split on the last dot then the worst of them will get filed under a much larger, much cleaner neighbour.
| Real ending | Domains | % blocked | Lazy method files it under | Which is actually |
|---|---|---|---|---|
.dynv6.net |
27 | 96.3% | .net |
16.0% |
.eu.org |
128 | 85.9% | .org |
15.0% |
.biz.id |
414 | 95.2% | .id |
- |
.my.id |
506 | 78.7% | .id |
- |
.web.id |
218 | 92.7% | .id |
- |
.name.ng |
13 | 76.9% | .ng |
9.8% |
.edu.kg |
47 | 63.8% | .kg |
50.0% |
.dynv6.net is blocked 96.3% of the time. Cut at the last dot and it becomes part of .net, which is blocked 16.0% of the time and looks perfectly fine. The single worst ending in the report disappears into one of the two cleanest buckets.
We’ve included .dynv6.net it in our list because it is a free subdomain service where you can sign up and get a hostname with no KYC or credit card requirement. That is the same thing a disposable email provider sells you, and it is why an ending that is not a TLD still belongs in this abuse report.
Going back to bucketing by endings, the .id family shows the disparity between a good TLD and a bad one best. Look at the following four endings - they all have completely different characters and score wildly different, but could have been clustered as one:
.ac.id- 0.5% blocked (Indonesian universities, basically clean).my.id- 78.7% blocked.web.id- 92.7% blocked.biz.id- 95.2% blocked
Cut at the last dot and all four merge into .id, reported as 46.0% across 2,171 domains. 46.0% is the pooled rate across all four, but it’s a useless number. We’re far more interested in the spread.
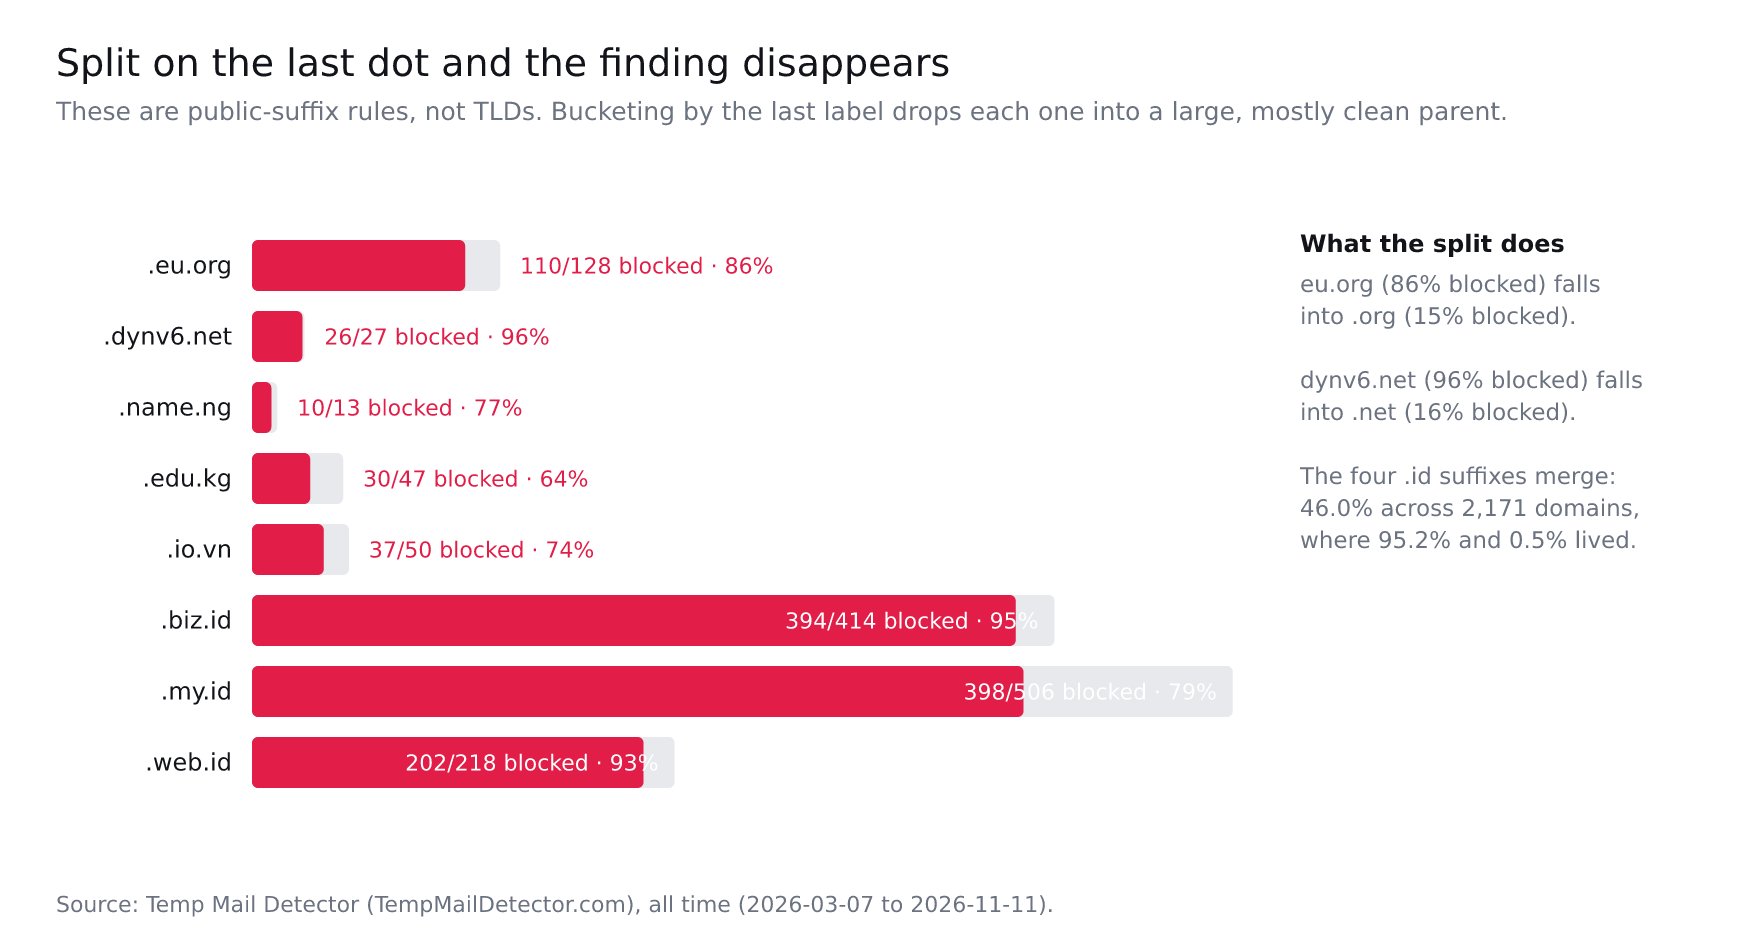
Then look at which ones get hidden. Not one of the biggest offenders is a
plain TLD. .dynv6.net and .eu.org are free services that hand out subdomains
to anyone; .my.id, .web.id and .biz.id are cheap second-level spaces sold
under .id. Free or near-free, obtainable with no real identity check, and
rotatable in seconds.
These aren’t all TLDs, and it matters
One thing the table above makes obvious once you look at it: .dynv6.net and
.eu.org are not top-level domains. .net is a TLD. .dynv6.net is a service
running inside one, handing out free subdomains to anyone who signs up.
The list that decides where an ending stops (Public Suffix List) doesn’t only contain TLDs. It also has a second half full of hosting companies, dynamic DNS providers and free-subdomain services, because browsers need to know that
you.vercel.app and someone-else.vercel.app are as unrelated to each other as
two different .com sites are. alwaysdata.net, github.io, vercel.app,
duckdns.org and dynv6.net are all in there.
So when we count endings, we count 1,620 of them, but only 1,512 are actual top-level domains:
| What it is | How many | Examples |
|---|---|---|
| Real top-level domains | 1,512 | .com, .co.uk, .edu.it, .my.id |
| Services handing out subdomains | 108 | alwaysdata.net, github.io, vercel.app, duckdns.org |
It’s important to report on dynv6.net (96.3% blocked) because even though it isn’t “technically” a TLD, it’s a huge driver of abuse and not sharing it would be problematic too.
Domain counts aren’t the whole picture though, if you want to know which disposable email providers are leading in the industry, our temp mail market share analysis tracks that separately, where a provider’s share of lookups moves independently of how many domains sit on a given ending
The findings, in one place
- We checked 257,054 domains across 1,512 top-level domains (1,620 endings in total, once you count the ones that aren’t TLDs). 33,965 (13.2%) were blocked as disposable.
- Popularity tells you nothing. Bigger endings are no dirtier than small ones (r = −0.04 across the 40 busiest).
.comis 42.8% of every domain we’ve checked - and still below the average block rate, at 11.9%..xyzis 1.4% of the domains and 8.9% of all the junk - a 6× concentration.- 40 endings out of 1,512 carry 29.3% of all the abuse, and cost you 1.40% of the good domains to block.
- The deal decays fast: 7 junk caught per innocent lost for the 20 worst endings, 3.2:1 at 40, and only 1.8:1 beyond that.
.edu,.edu.itand.ac.inare 4,194 domains with zero blocks..topis 827 domains with 683 blocks, using same block threshold..aiblocks 1.7% of its domains but scores 1.8× higher than its block rate predicts. New startup and spammer look similar to a score.- Splitting on the last dot folds
.dynv6.net(96.3% junk) into.net(16.0%) and.eu.org(85.9%) into.org(15.0%). - The
.idending contains both legitimate educational domains (0.5% blocked) and a large number of abusive domains (95.2% blocked) - The 40 worst endings are 5.8% of the domains and 29.3% of all the abuse.
How we got these numbers
- Where it comes from: our production database of scored domains. One row per domain, recorded the first time we ever saw it, so a domain is counted once, from when it first appeared. We have recorded blocked domains over many years, but have only recently started recording all domain scores, which has allowed us to run this analysis.
- The blocking rule: any domain scoring 75 or more is blocked, and the “blocked” flag is calculated from the score rather than stored separately. So the flag can never disagree with the number.
- Endings: looked up against the public suffix list, not split on the dot. Each ending is then tagged as a real TLD or a subdomain service, which is where the 1,512 / 108 split comes from. One stray label that is absent from the public suffix list entirely is excluded from the counts.
- Percentages: each ending’s block rate is
blocked ÷ totalfor that ending. Not an average of per-domain yes/no flags. - Tooling: We wrote a small tool to pull out the domain ratings, sanitise the data and run the numbers. Every figure in this post is generated from our data.
Cite this
If you want to quote these numbers:
An analysis of 257,054 domains by Temp Mail Detector found that 13.2% of domains checked were blocklisted as disposable. 40 of the 1,512 TLDs observed accounted for 29.3% of all blocked domains while representing just 1.40% of legitimate domains, and the three largest university suffixes detected (.edu, .edu.it, .ac.in) recorded zero blocks across 4,194 domains.
Or:
40 domain endings out of 1,512 account for 29% of all disposable-email abuse, according to Temp Mail Detector’s analysis of 257,054 domains.
Every chart in this post is free to reuse with attribution.